Install Simple Scalable Loki Promtail Grafana stack in KIND cluster
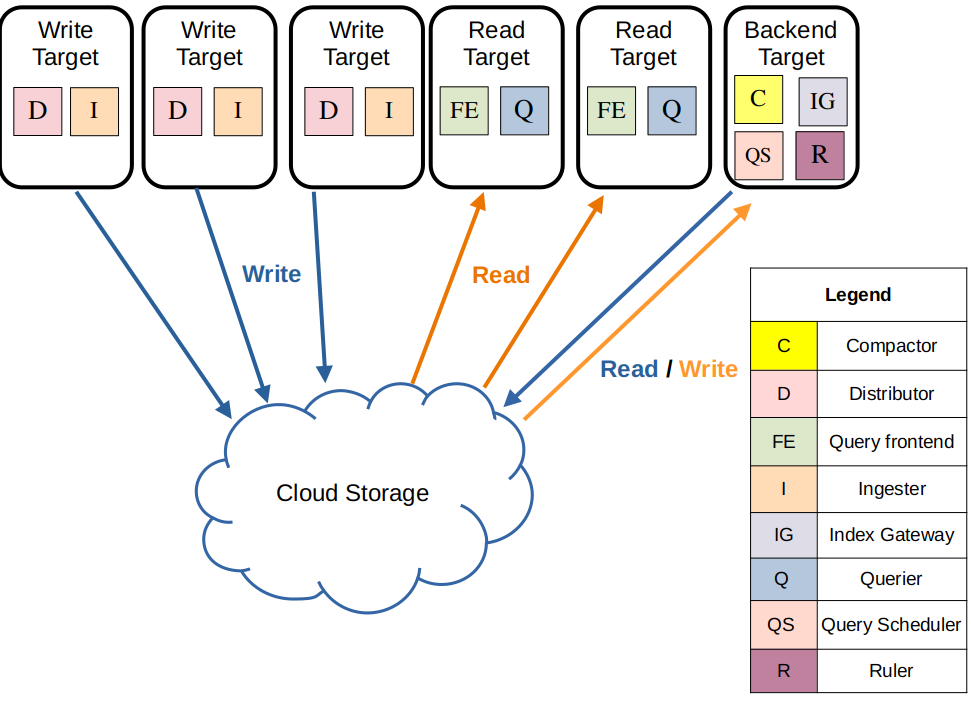
Loki’s simple scalable deployment mode separates execution paths into read, write, and backend targets. These targets can be scaled independently, letting you customize your Loki deployment to meet your business needs for log ingestion and log query so that your infrastructure costs better match how you use Loki.
The three execution paths in simple scalable mode are each activated by appending the following arguments to Loki on startup:
- -target=write - The write target is stateful and is controlled by a Kubernetes StatefulSet. It contains the following components: – Distributor – Ingester
-
-target=read- The read target is stateless and can be run as a Kubernetes Deployment that can be scaled automatically (Note that in the official helm chart it is currently deployed as a stateful set). It contains the following components: – Query front end – Queriers -
-target=backend- The backend target is stateful, and is controlled by a Kubernetes StatefulSet. Contains the following components: – Compactor – Index gateways – Query scheduler – Ruler The simple scalable deployment mode requires a reverse proxy to be deployed in front of Loki, to direct client API requests to either the read or write nodes. The Loki Helm chart includes a default reverse proxy configuration, using Nginx.
Have a KIND cluster
ref: mykindk8scluster or Demo Environment
Install Loki
git clone https://github.com/naren4b/loki-app.git
cd loki-app
helm repo add grafana https://grafana.github.io/helm-charts
helm repo update
helm pull grafana/loki --untar # optional
helm upgrade --install  loki grafana/loki  -f simple-scalable-values.yaml -f my-values.yaml
Install promtail
cat<<EOF >$PWD/promtail-demo-values.yaml
config:
  clients:
    - url: http://loki-gateway/loki/api/v1/push
      tenant_id: 1
extraPorts:
   syslog:
     name: tcp-syslog
     annotations: {}
     labels: {}
     containerPort: 8514
     protocol: TCP
     service:
       type: ClusterIP
       clusterIP: null
       port: 1514
       externalIPs: []
       nodePort: null
       loadBalancerIP: null
       loadBalancerSourceRanges: []
       externalTrafficPolicy: null
EOF
REPO_NAME=grafana
REPO_PATH=promtail
CHART_VERSION=6.15.3
CHART_APP_VERSION=promtail
helm install promtail ${REPO_NAME}/${REPO_PATH}  --version ${CHART_VERSION} -f $PWD/promtail-demo-values.yaml
Install Grafana
kubectl run grafana --image=grafana/grafana --port=3000
kubectl expose pod grafana --port=3000 --name=grafana
kubectl port-forward svc/grafana 3000:3000 --address 0.0.0.0
#data-source: http://loki-gateway
#ref: https://github.com/grafana/loki/issues/9756#issuecomment-1918895042
[Add Loki data source ]
url: http://loki:3100
Visit http://localhost:3000/connections/datasources/loki
Visit http://localhost:3000/dashboard/new?orgId=1